

In this week's edition, a selection of new reports and charts that were released around COP 31 in Antalya, Türkiye. This includes charts on climate mitigation and adaptation, climate finance, just transitions, and economic analysis. All dollar amounts are in USD.
This was my favourite chart of COP 31. It naturally directs one's thoughts toward the trade-offs between quantity and quality...
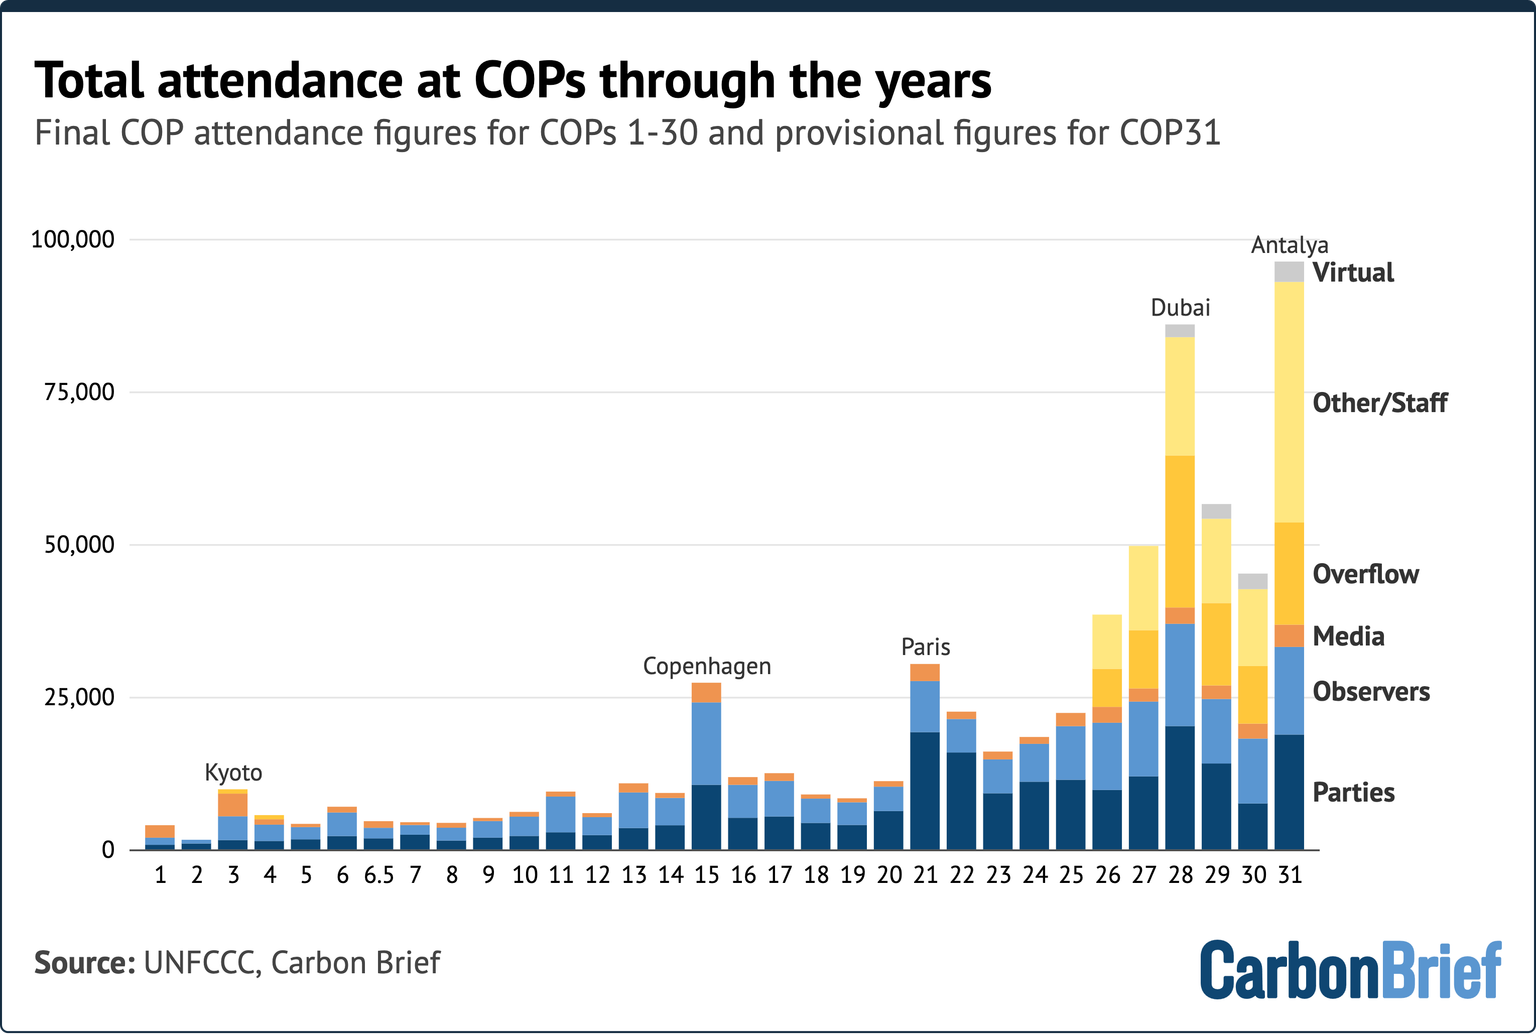
With regard to the outcomes at COP 31 in Antalya, Türkiye, the coverage by Carbon Brief is, as usual, peerless.
 Carbon Brief Staff

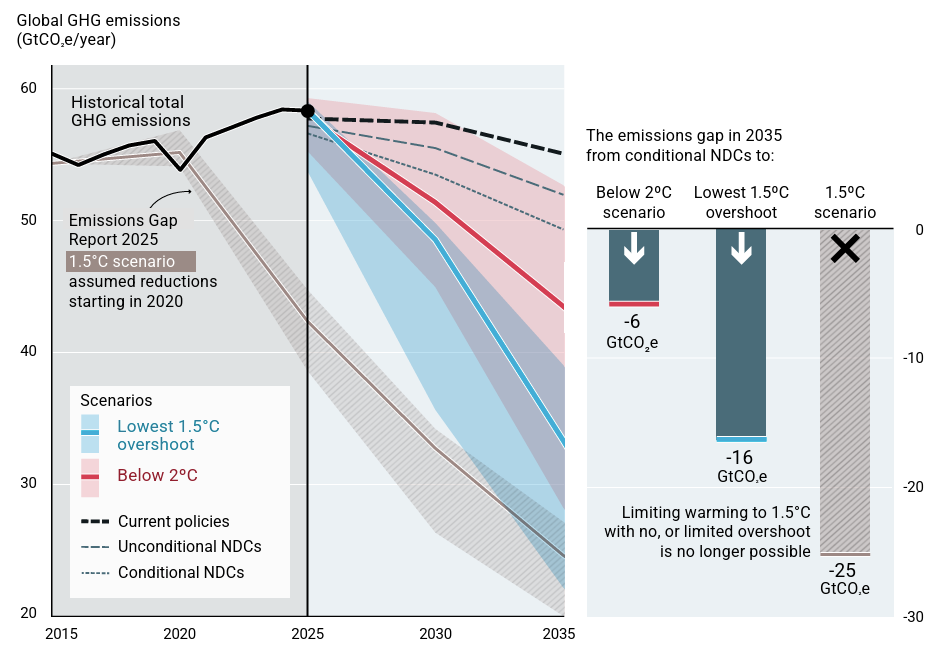
The annual Emissions Gap Report is one of the big framing reports released each COP by the UN Environment Programme (UNEP). The year's edition, The Point of No Return, rules out <1.5°C as a viable scenario. At best, we are into overshoot territory.
On the bright side, however, global GHG emissions might have declined slightly between 2024 and 2025, which raises the prospect that global emissions have peaked. 2026 is very likely to accelerate that trend, given the tightening of oil and gas supply from the US-Israel–Iran war and its consequences for CO2 emissions (further discussion below).
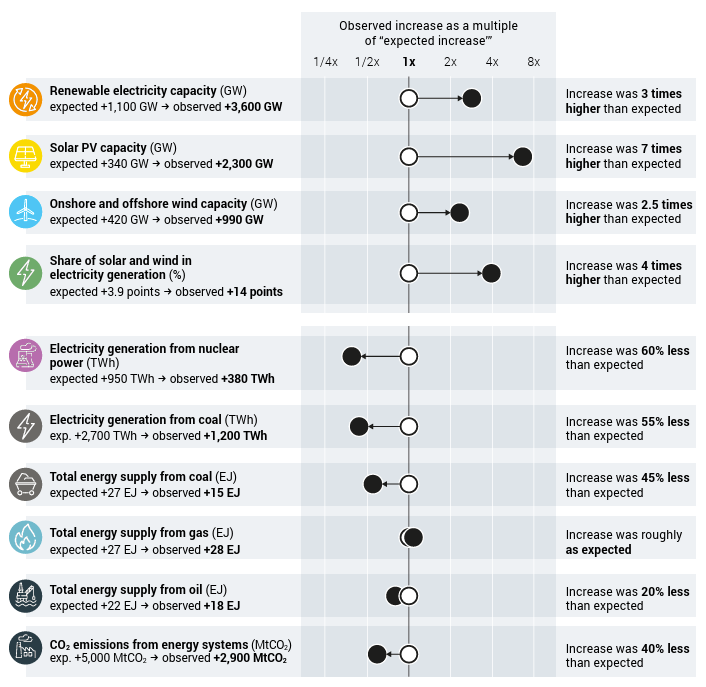
Another ray of hope: the chart below shows the way that key technologies are outstripping historical expectations. It compares past projections from the IEA World Energy Outlook 2015 with present-day realities, showing that renewable energy technologies are rolling-out far faster than projected. Relatedly, the growth rates of coal energy are roughly half of what was expected.
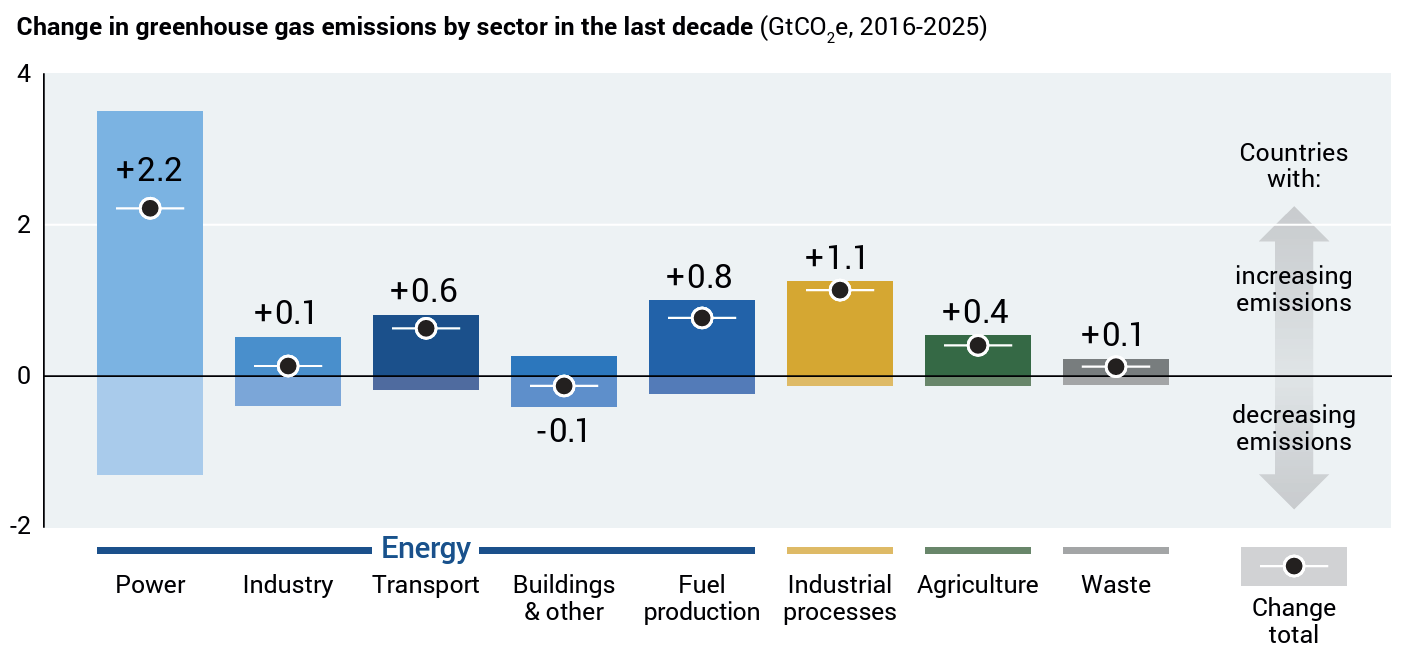
But there are headwinds as well as tailwinds. The chart below shows which sectors are making the greatest progress over the past decade (2016–2025). A growing number of countries are reversing total emissions in the power sector especially, and also industry and buildings. But this is counterbalanced by emissions associated with economic development in other countries. For example, power sector emissions decreased in 90 countries, but increased in 93 countries, resulting in a net change of +2.2 GtCO2e. Ensuring those countries shift onto cleaner development pathways, especially by way of electrification and renewable energy, is critical.
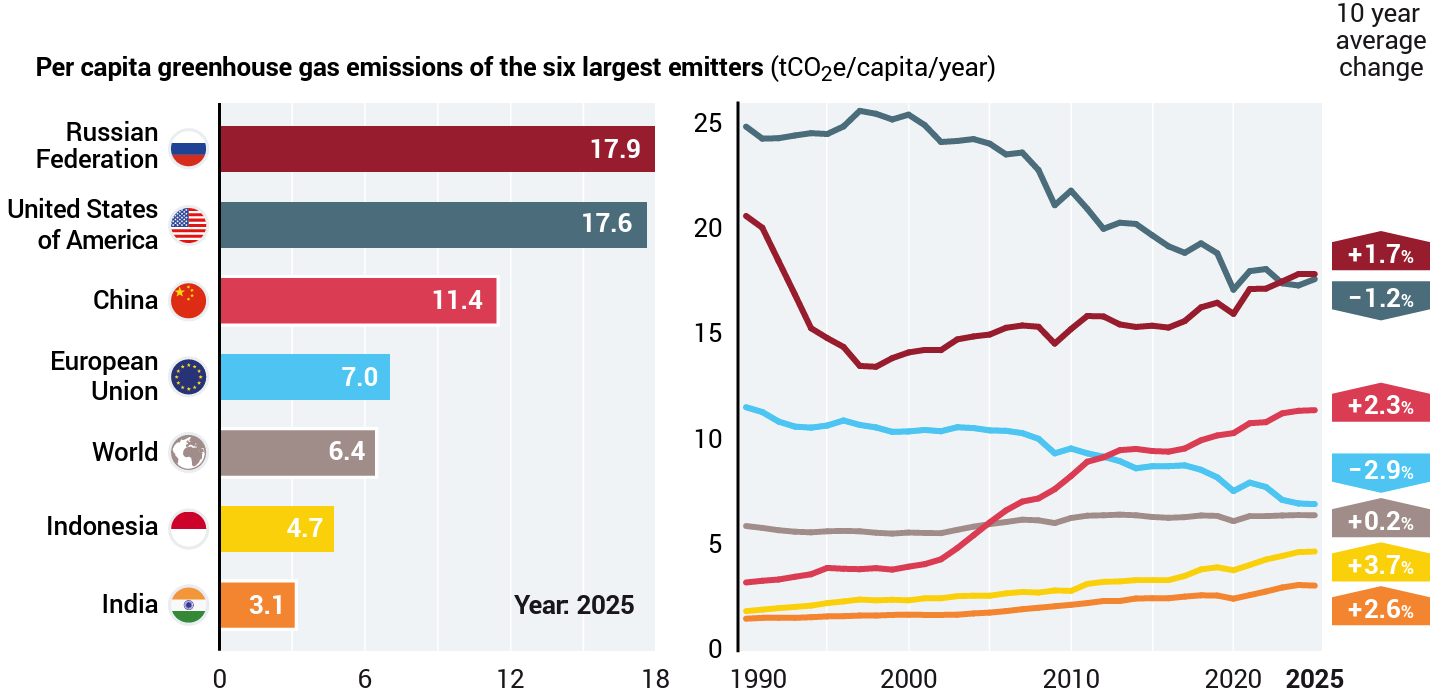
Finally, the charts below, which track per capita CO2 emissions among the world's six largest emitters, reveal the variance in geographic and historical trends:

On the topic of technology, the International Renewable Energy Agency (IRENA) released its World Energy Transition Outlook 2026: 1.5°C Pathway.
As the subtitle implies, IRENA is trying keep 'one-point-five alive' by modelling the additional actions that might return the world to a 1.5°C-compatible pathway, following a limited and temporary overshoot. IRENA recommends:
- Develop integrated planning and market frameworks to provide clear long-term signals for competitive markets and private investment.
- Develop and implement country-tailored transition roadmaps.
- Accelerate investment to expand and modernise energy infrastructure.
- Design integrated industrial strategies to maximise local value creation in clean energy industries, and expand workforce capabilities through skills development.
- Establish stable policy and investment frameworks, including the strategic deployment of public finance, to provide predictable investment signals and lower the cost of capital.
- Maximise social, economic and environmental benefits for a just energy transition by promoting household affordability, community benefits, equitable economic opportunities, social and environmental protection.
- Strengthen international co-operation through technology transfer, knowledge exchanges, industrial partnerships, and economic co-operation.
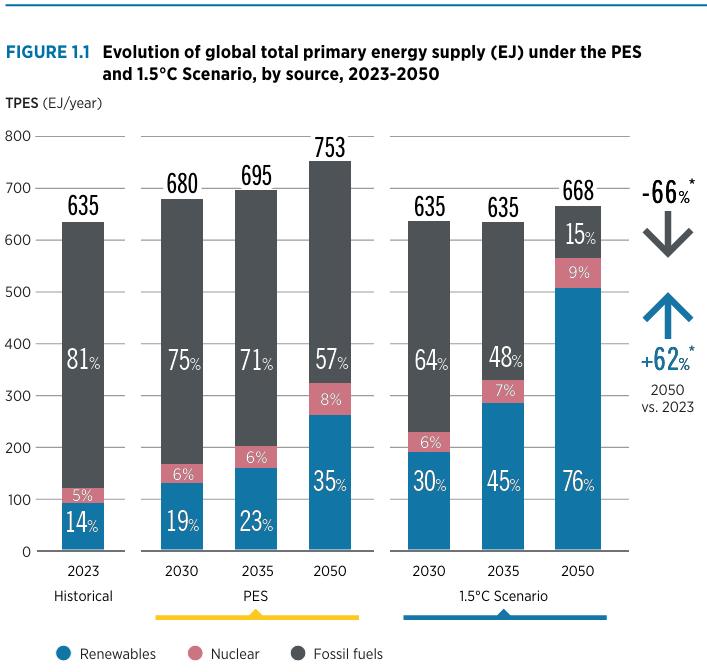
If that's implemented, then the 1.5°C Scenario is possibly within reach, which would increase the share of renewable energy from 14% of primary energy supply in 2023 to 76% by 2050 (see the chart below). By contrast, the Planned Energy Scenario (PES), which models the transition under existing plans and targets, only results in renewables achieving a 35% share by 2050. So that extra ambition really makes a difference.
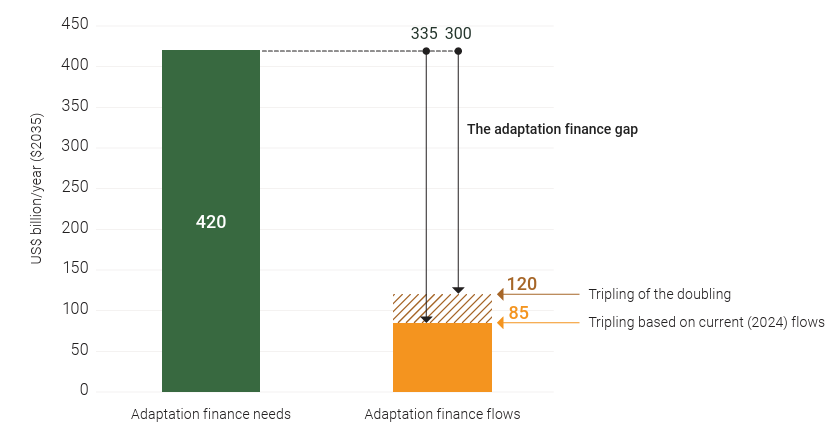
The Adaptation Gap Report (AGR) is the other of UNEP's big framing reports. The 2026 edition, Ready? Not, finds that developing countries will require roughly $305 billion annually by 2035 to build resilience and reduce risks (see the chart below). Even if the COP30 call to triple adaptation finance by 2035 is fulfilled, this leaves developing countries a long way short of funding needs..
AGR 2026 also spotlights the issue of loss and damage, which becomes ever more relevant as the impacts of climate change materialize. Below is a framework for assessing the exposure of countries or regions to climate-related losses and damages, and also their ability to cope and recover. It also identifies what type of information is required for evidence-based decision making. To make it real, ask yourself whether your region has all these pieces in place.
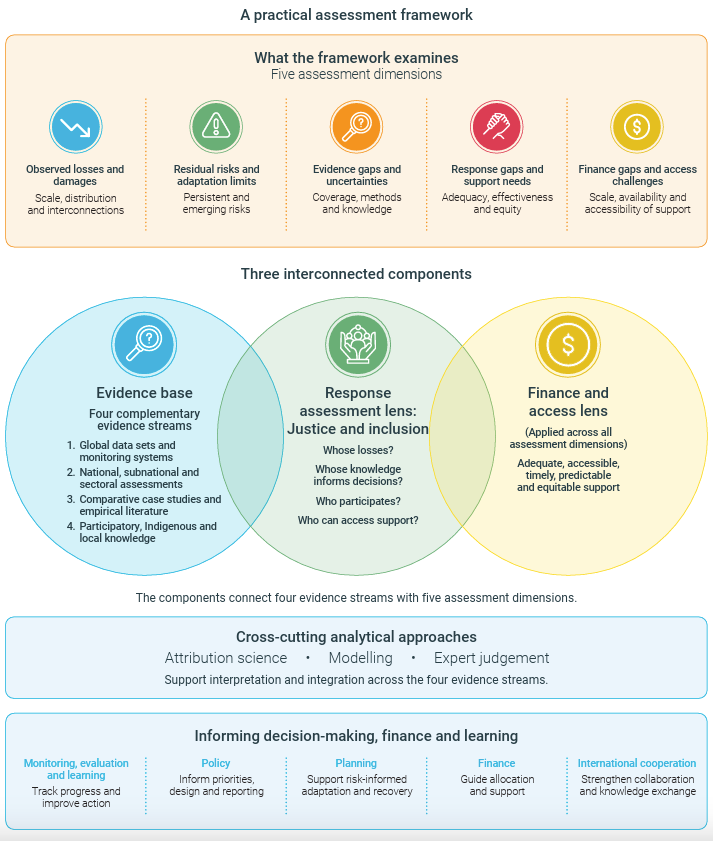


UNEP's work on losses and damages is operationalizing the in-principle decision at COP 27 (Sharm el-Sheikh, 2022) to create a fund to support countries' recoveries from climate-related disasters. This became the Fund for Responding to Loss and Damage (FRLD), which had its first-ever extraordinary board meeting on 22 October 2026 to consider a request from Nepal, following the nightmarish flash floods two months earlier.
The FRLD Board provisionally set aside $20 million for Nepal, plus a $1.6 million oversight fee. This is less than one per cent of the likely costs of loss and damage, which the Nepal government estimated at about $2.69 billion. Additionally, the assessment of recovery needs was estimated at $4.77 billion.
This ought to put us all on alert with regard to the obscene mismatch between the economic costs of climate change and the world's fiscal response. Currently, combined commitments to the FRLD sit at a mere $822.71 million, with only $485.97 million received. A single event can easily wipe this out.
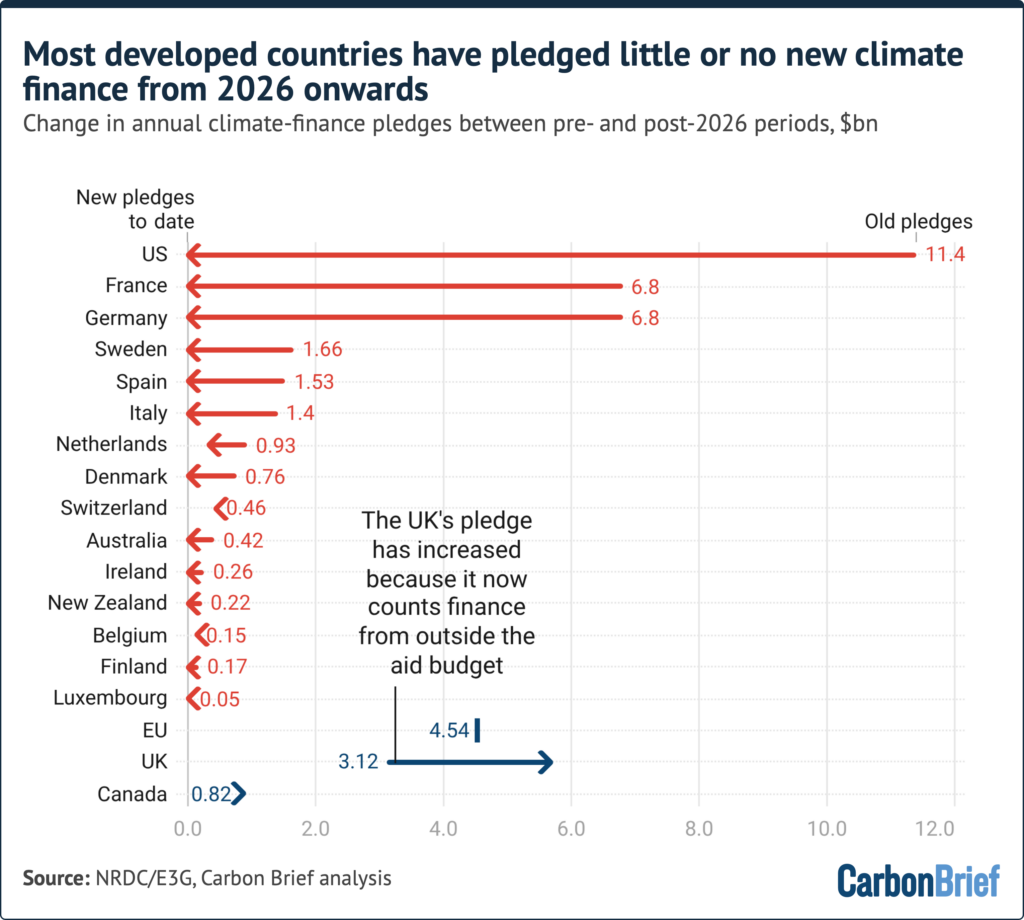
Which brings us, of course, to the issue of climate finance. As I reported from the UN Biodiversity Conference COP 17, we are in an era of fiscal constraint (see The Shift #4), which is no less constraining for the UN Climate Conference COP 31. Carbon Brief analysis shows that pledges of climate finance are falling across the board (see the chart below).
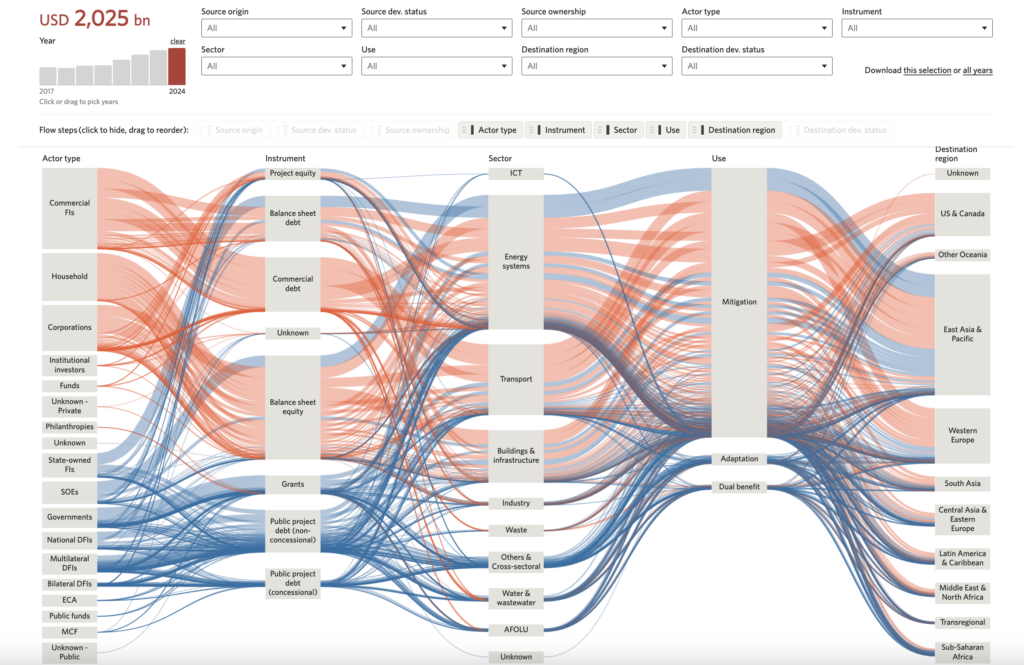
Climate Policy Initiative (CPI) released a deep dive into climate adaptation as part of its Global Landscape of Climate Finance 2026.
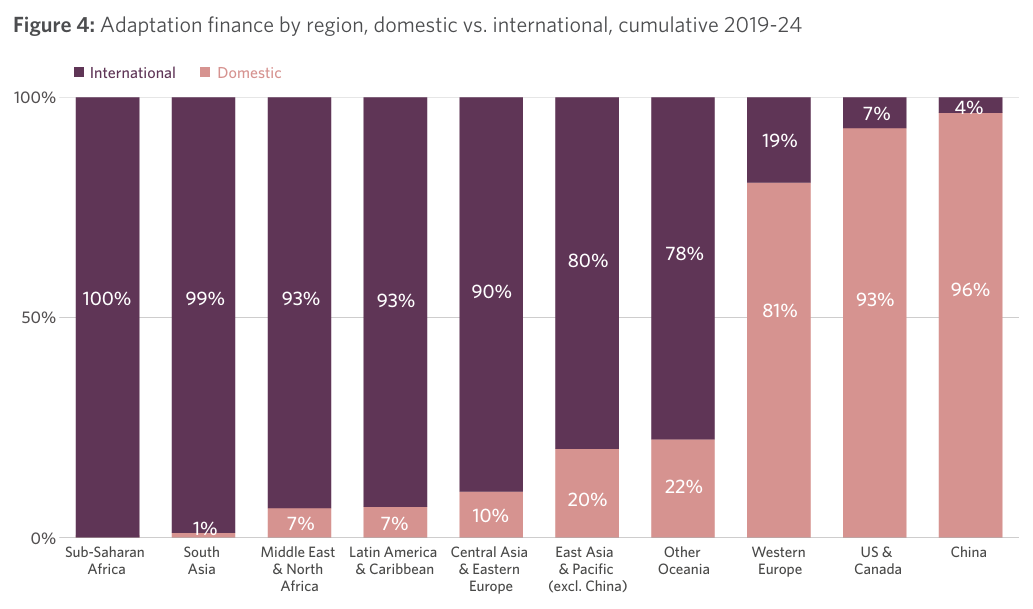
The chart below shows the inherent geopolitics in adaptation finance flows – with Europe, North America and China largely investing in their own resilience, while the remainder of the world relies on international sources.
Also notable is the extent to which public debt is the major driver of global adaptation finance (see chart below).
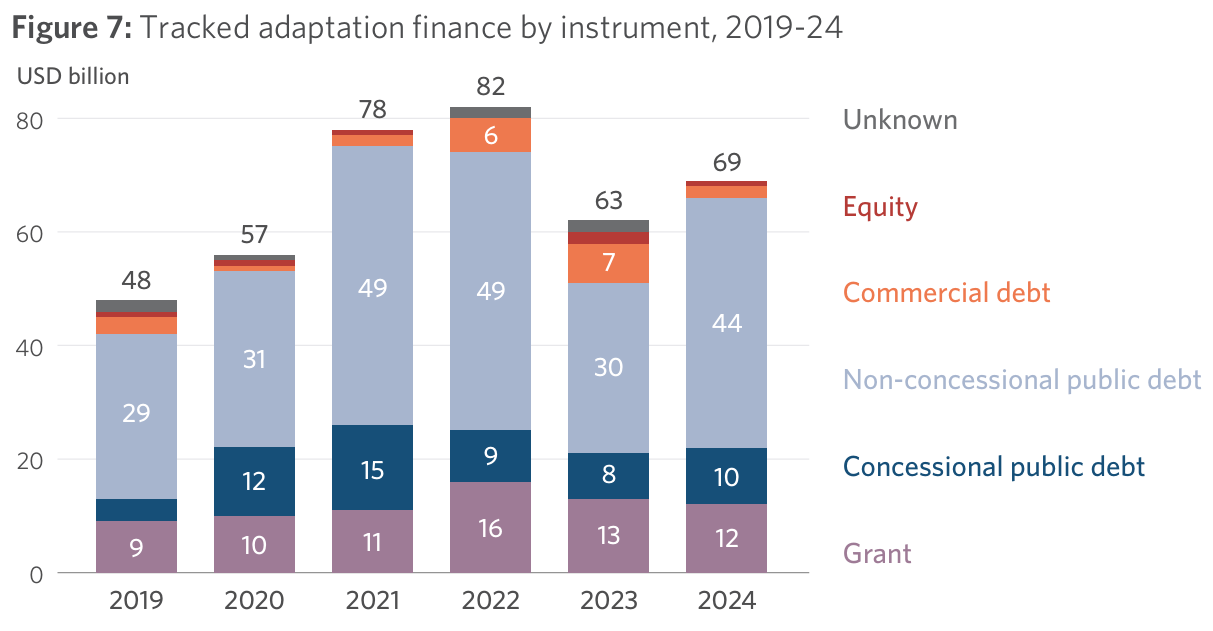
For the countries in debt distress (e.g. Republic of the Congo, Laos, Sudan, Yemen, Zimbabwe), non-repayable grants are the major source of funding; specifically, 73% of funds received were grants and 27% was concessional debt in 2024. However, among at-risk countries, the role of public debt increases. Countries with a low debt sustainability rating (e.g. Nepal, Cambodia, Honduras, Myanmar, Solomon Islands, Uzbekistan) are receiving 90% of adaptation finance as public debt, 46% concessional and 44% non-concessional (see chart below).
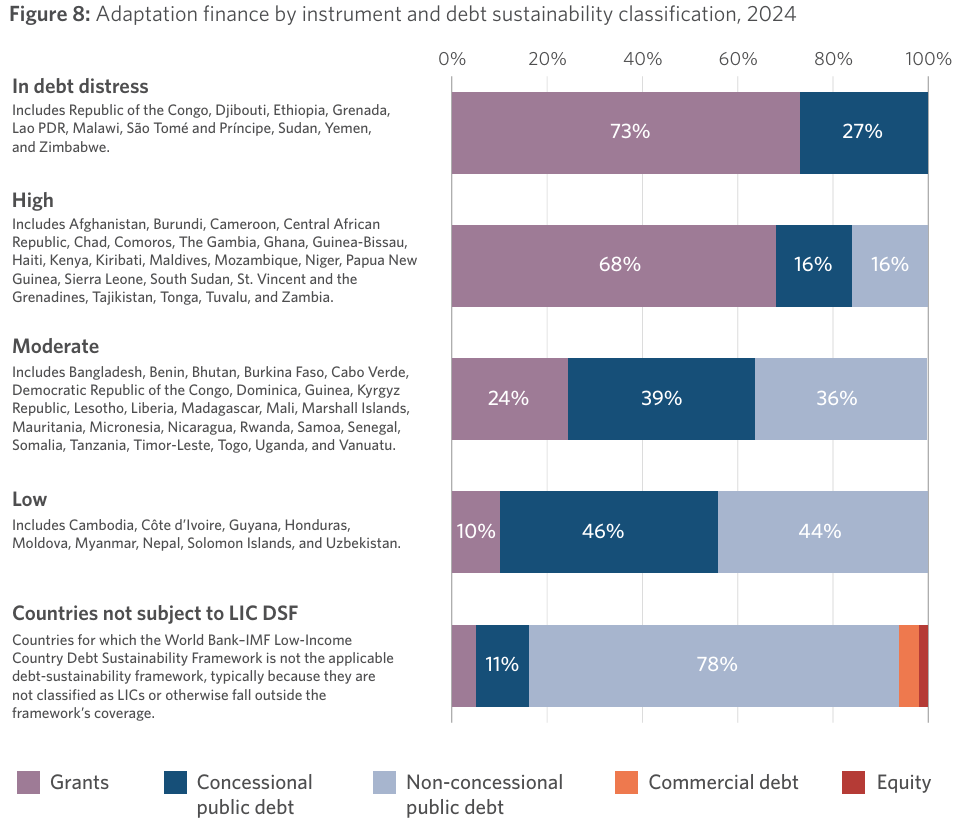
As CPI writes:
The continued use of non-concessional public lending for countries at moderate and high risk of debt distress raises questions over the long-term sustainability of adaptation financing. While these loans may offer better terms than those from private markets, particularly where public institutions borrow at lower cost, they still create debt-service obligations.
Explore more in the full report or the CPI's interactive dashboard:

Continuing with the theme of international climate finance, one of the innovations that emerged from COP 30 in Bélem last year was the global agreement to develop a Just Transition Mechanism (JTM), alongside other international and multilateral instruments, which would support countries through the challenges of decarbonizing their economies.
LSE's Just Transition Finance Lab is doing excellent work on this subject, which includes this discussion paper on the potential design of what is increasingly being called the Belém-Antalya Mechanism (BAM).
The main takeaway is that uncertainty is high. The paper notes that while 79% of country pledges now reference just transitions, only 26% attach a financial figure. With no common tracker, needs estimates for just transitions globally range from an 'illustrative' $50 billion a year by 2035 to a 'highly conservative' $420 billion a year. Consequently, the Just Transition Finance Lab recommends an experimentalist approach:
Work so that the BAM becomes a laboratory of what qualitative finance can look like in practice – generate learnings and good practices from BAM operations on channeling and scaling up Just Transition finance that would help inform and expand knowledge on qualitative climate finance.
 Jodi-Ann Wang

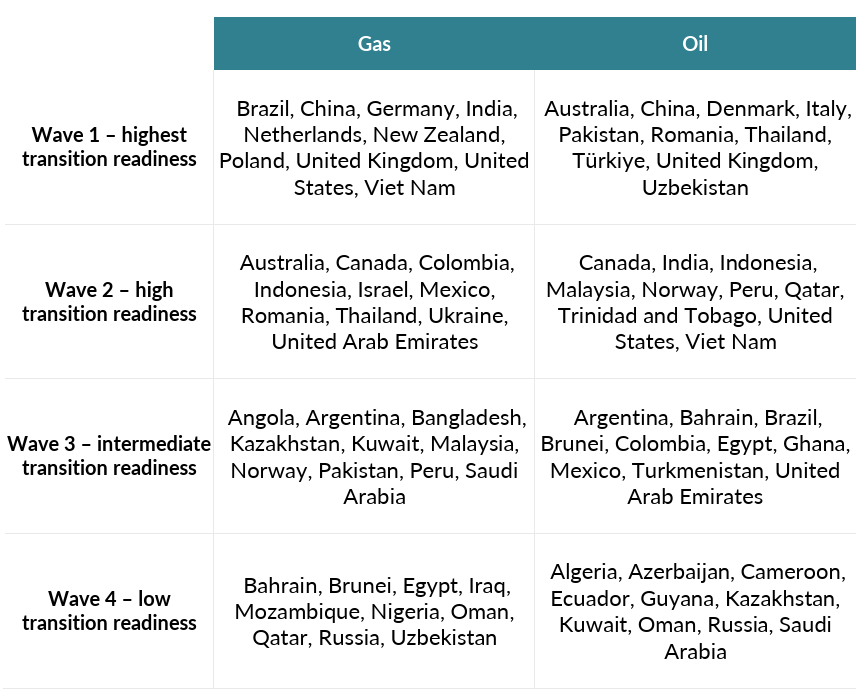
To understand the need for such a fund, Climate Analytics produced this fascinating report on just transitions, End of the Pipeline: Managed vs market-driven routes to ending fossil fuel production. Underpinning its analysis is the concept of transition readiness (see chart below), which categorizes various countries on their lower dependency on fossil fuel production (y-axis) and higher fiscal and institutional capacity (x-axis).
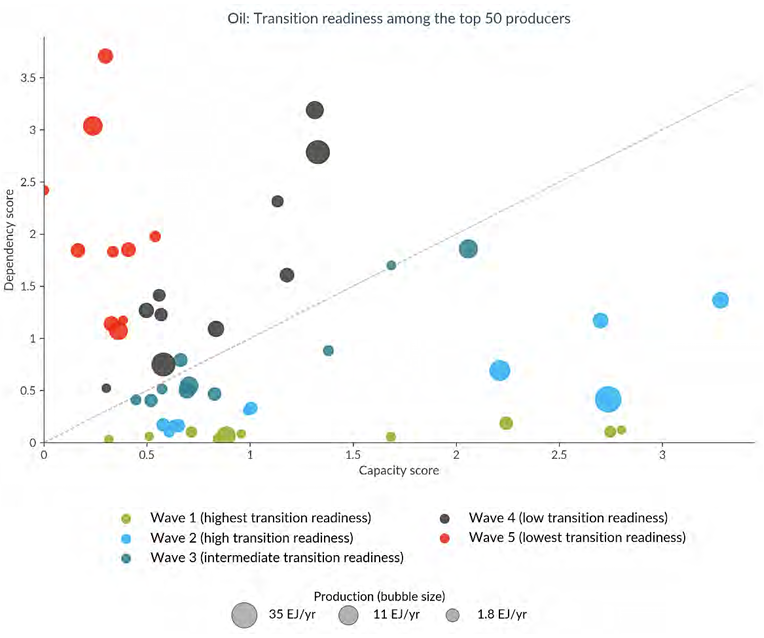
The countries most locked into fossil fuels are Nigeria (W5 oil, W4 gas), Angola (W5 oil), Algeria (W5 gas), Iraq (W5 oil, W4 gas) and Iran (W4 gas, W5 oil). These countries have high dependency on fossil fuel production for exports and the domestic economy, plus low economic and institutional capacities.
By contrast, the most transition-ready countries are the developed countries, like New Zealand, plus countries where fossil fuels are marginal to the economy, like Indonesia, Viet Nam and Peru (see the table below).
The report concludes by warning that a market-driven transition away from fossil fuels, which leaves the costs where they fall, would be ruinous for Wave 4 & 5 countries:
This would pose supreme challenges for their fiscal and macro-economic stability and would likely lead to large-scale negative social consequences, as declining fossil fuel revenues erode already-strained public spending on key provisions such as health and education. This would severely undermine the just transition.
This is contrasted with a coordinated approach, which sequences the phase-out of production by beginning with countries with the greatest transition readiness, then working its way through those with the least transition readiness. This might 'smooth the pathway' for the most fossil-dependent countries:
Coordination can modulate the phase-out dynamics that deep mitigation scenarios require, but it cannot eliminate them.


Revisiting the question of whether global emissions have peaked, the Global Carbon Project (GCP) annual data-dump is critical.
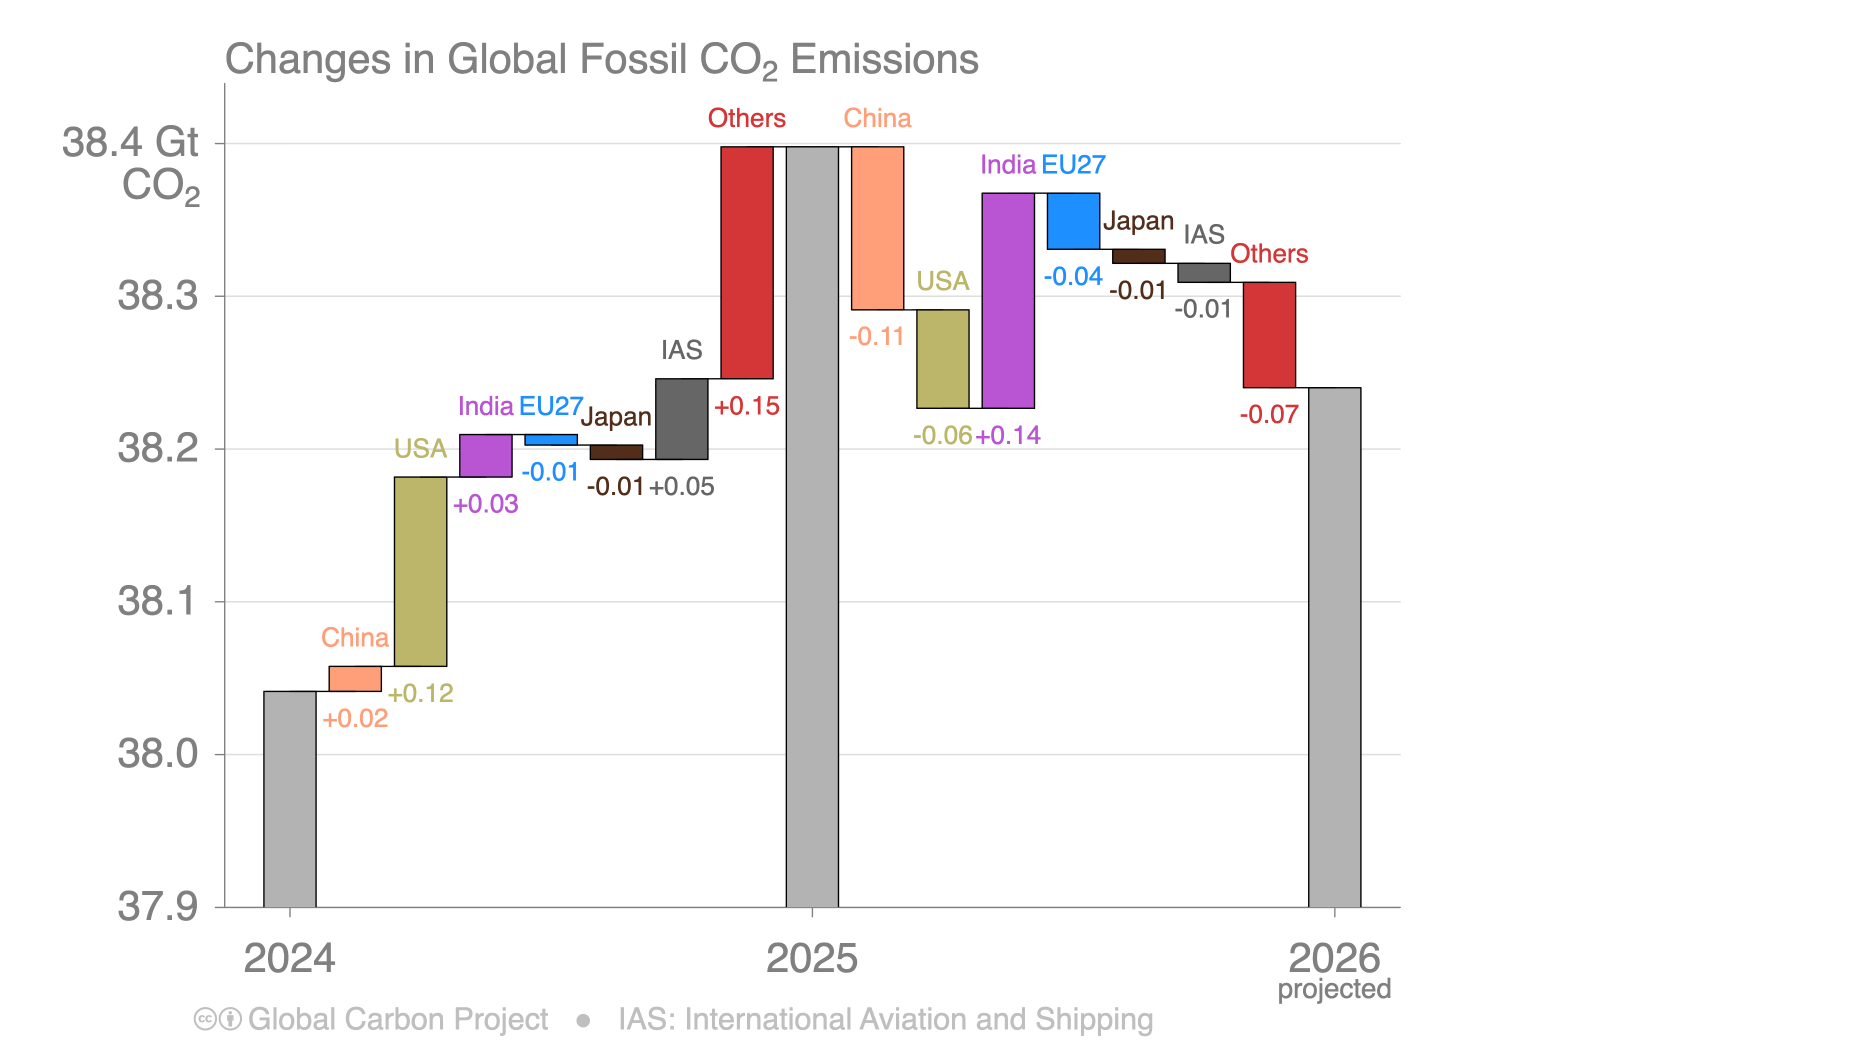
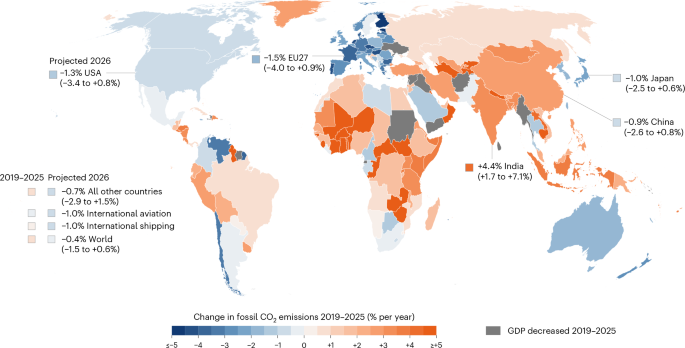
Focusing on fossil CO2 emissions, the major driver of climate change, there appears to be a slight decline this year – from 38.4 gigatonnes (Gt) in 2025 to a projected 38.2 Gt in 2026 (see the chart below). This data set incorporates the Middle East conflict and the closure of the Strait of Hormuz, so this might prove a temporary blip, like the GFC and Covid-19 pandemic. However, structural changes are also gathering pace, as discussed earlier, through the accelerating uptake of renewable energy technology and end-use electrification. So there is a chance that the decline gets locked in.
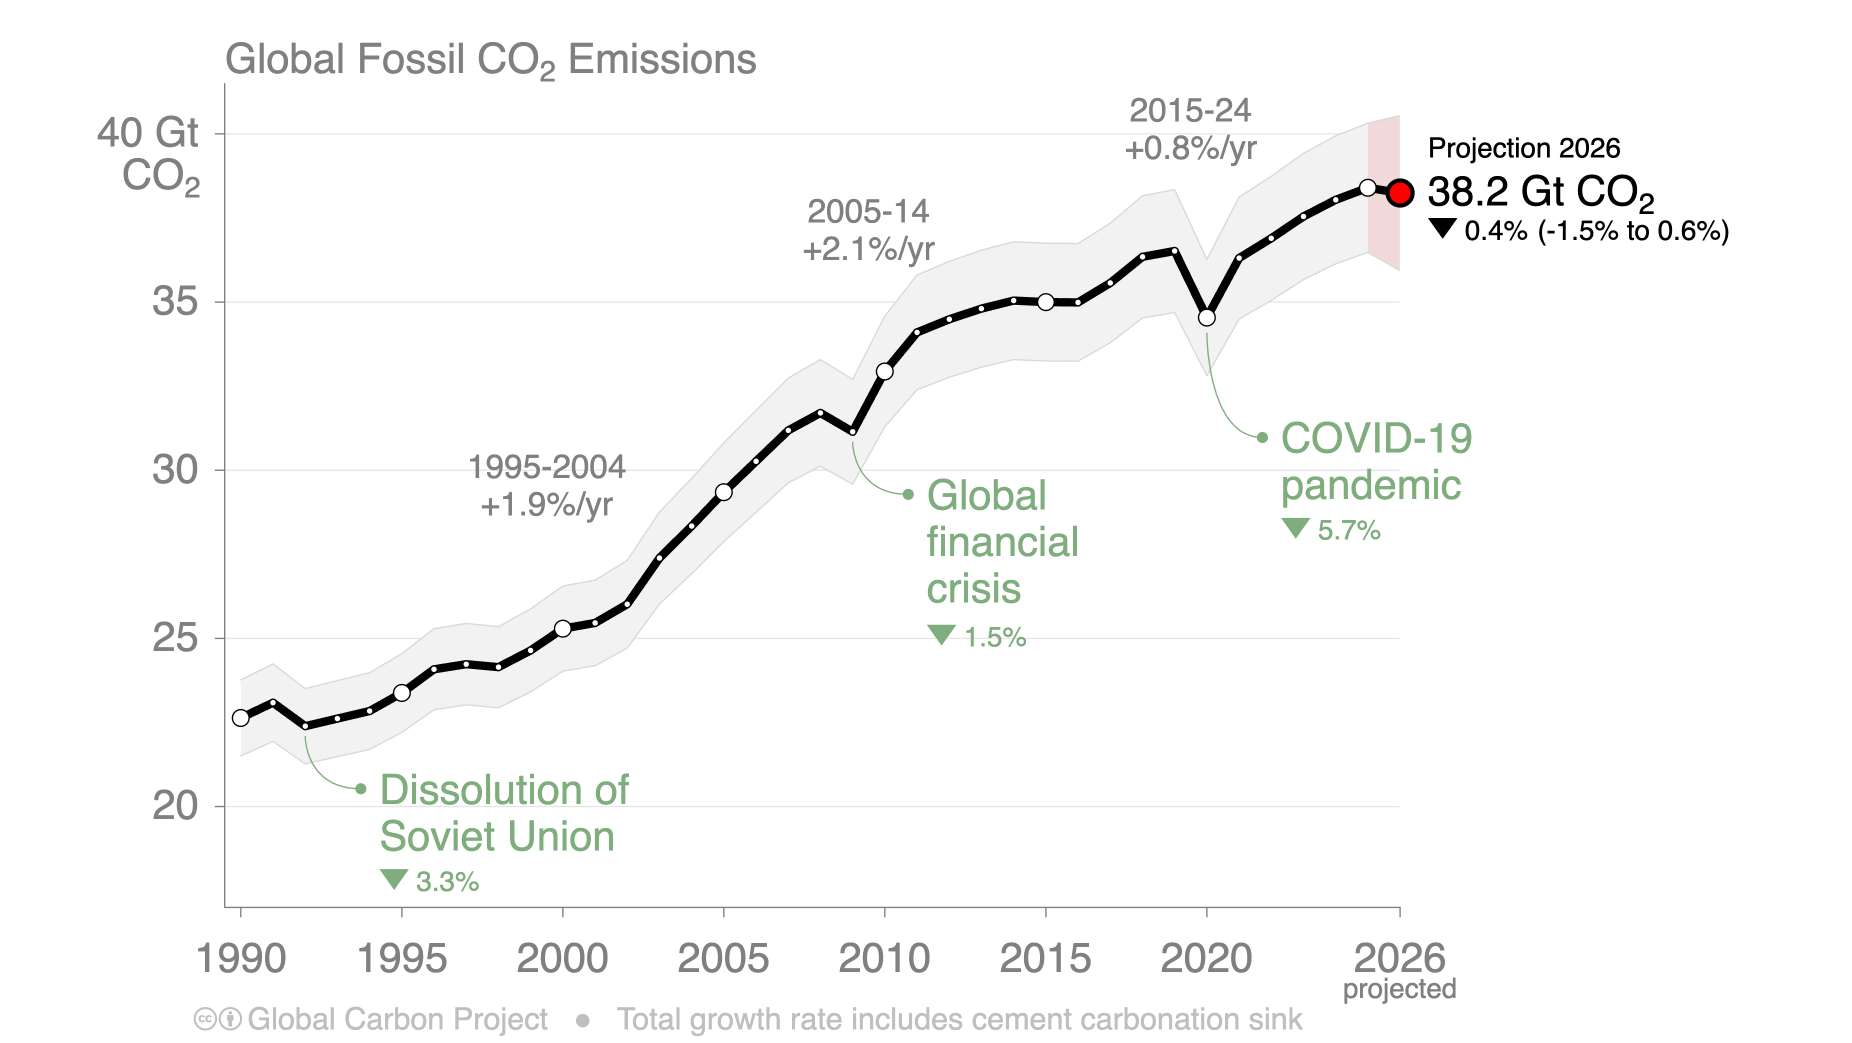
For a breakdown of how this looks across large emitters, the declines in fossil CO2 emissions are spread across China, USA, EU, Japan and international transport. By contrast, India's CO2 emissions have accelerated, which reinforces the unique significance of India's development trajectory for global emissions (see The Pointillist #7).
The flipside of these charts is the quantification of avoided emissions, which is gathering pace (see the charts below). Without the emissions avoided by renewable energy and EVs, GCP researchers estimate that global CO2 emissions would have grown by an average 1.9% per year during 2019–2025.
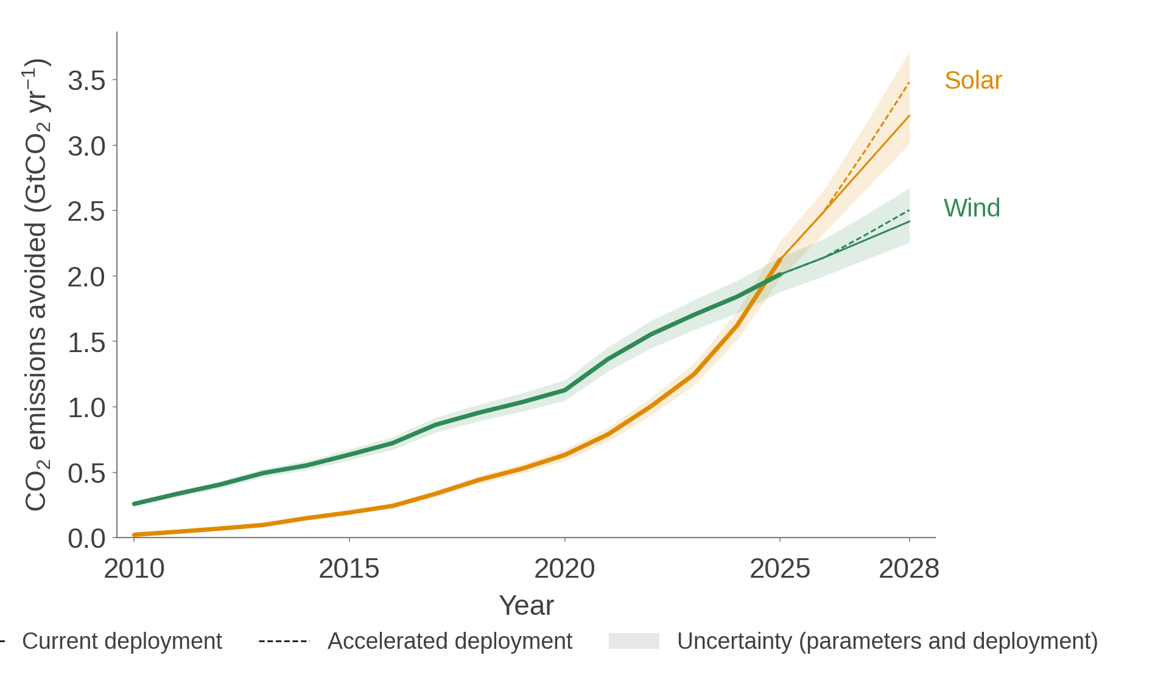
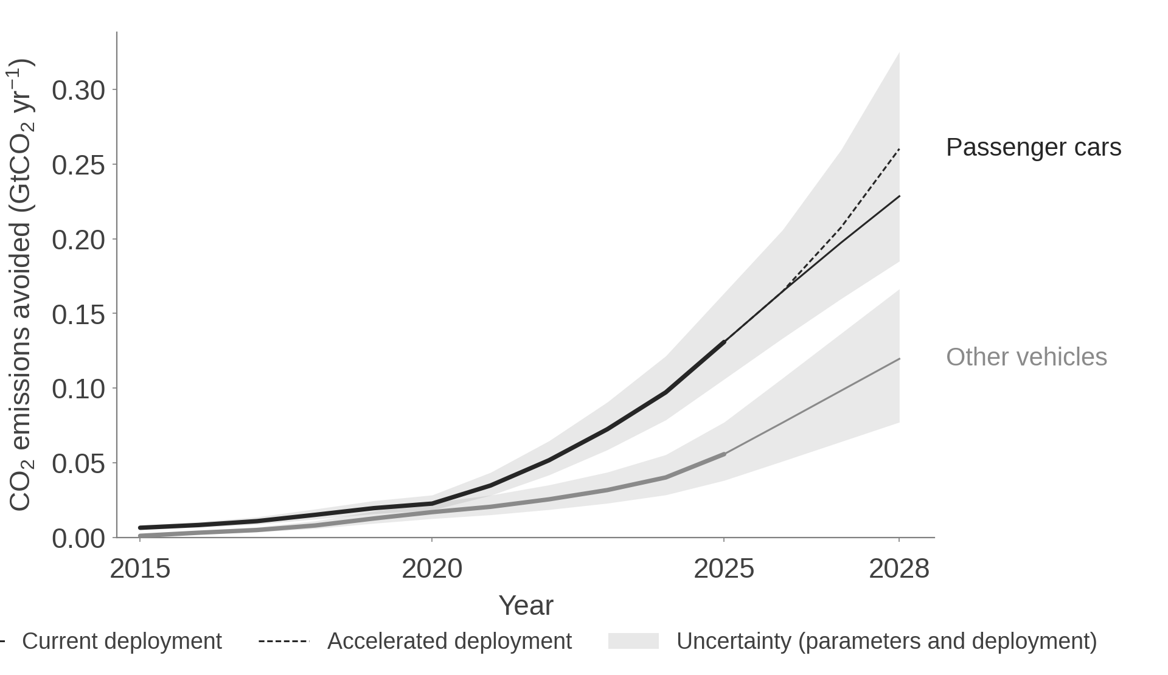
However, they also argue that 'energy transition drivers are not yet strong enough to overcome the anticipated emissions from demand growth'. To be confident that this year's decline in CO2 emissions is permanent, they argue that we need 'an unlikely combination of low GDP growth, low CO2 intensity of GDP, [and] accelerated clean technology deployment'.
 Corinne Le Quéré
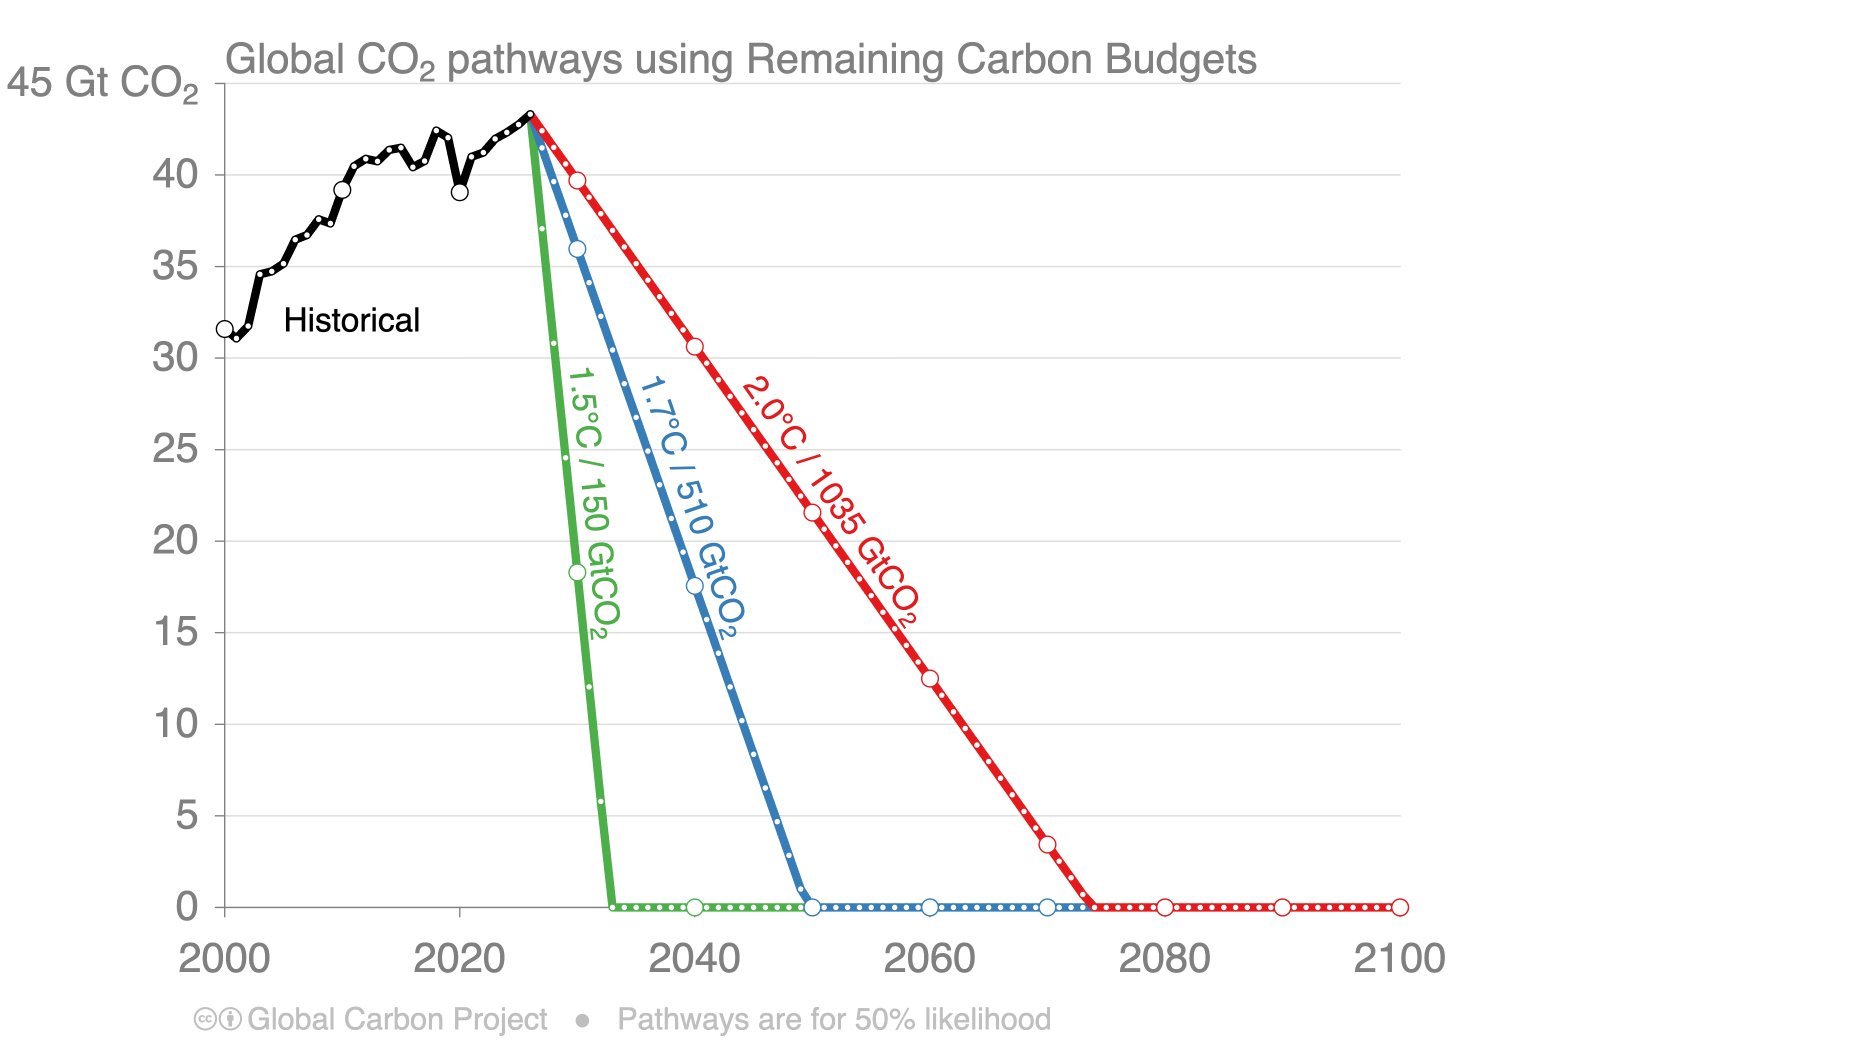
The problem is that every year we fail to peak emissions, the carbon budgets for the Paris Agreement become ever less achievable, as demonstrated so clearly in the updated chart below.
 JV

For a more holistic approach to sustainability that goes beyond greenhouse gas emissions, the Potsdam Institute for Climate Impact Research (PIK) has updated its Planetary Health Check, which assesses a diverse set of indicators, or planetary boundaries.


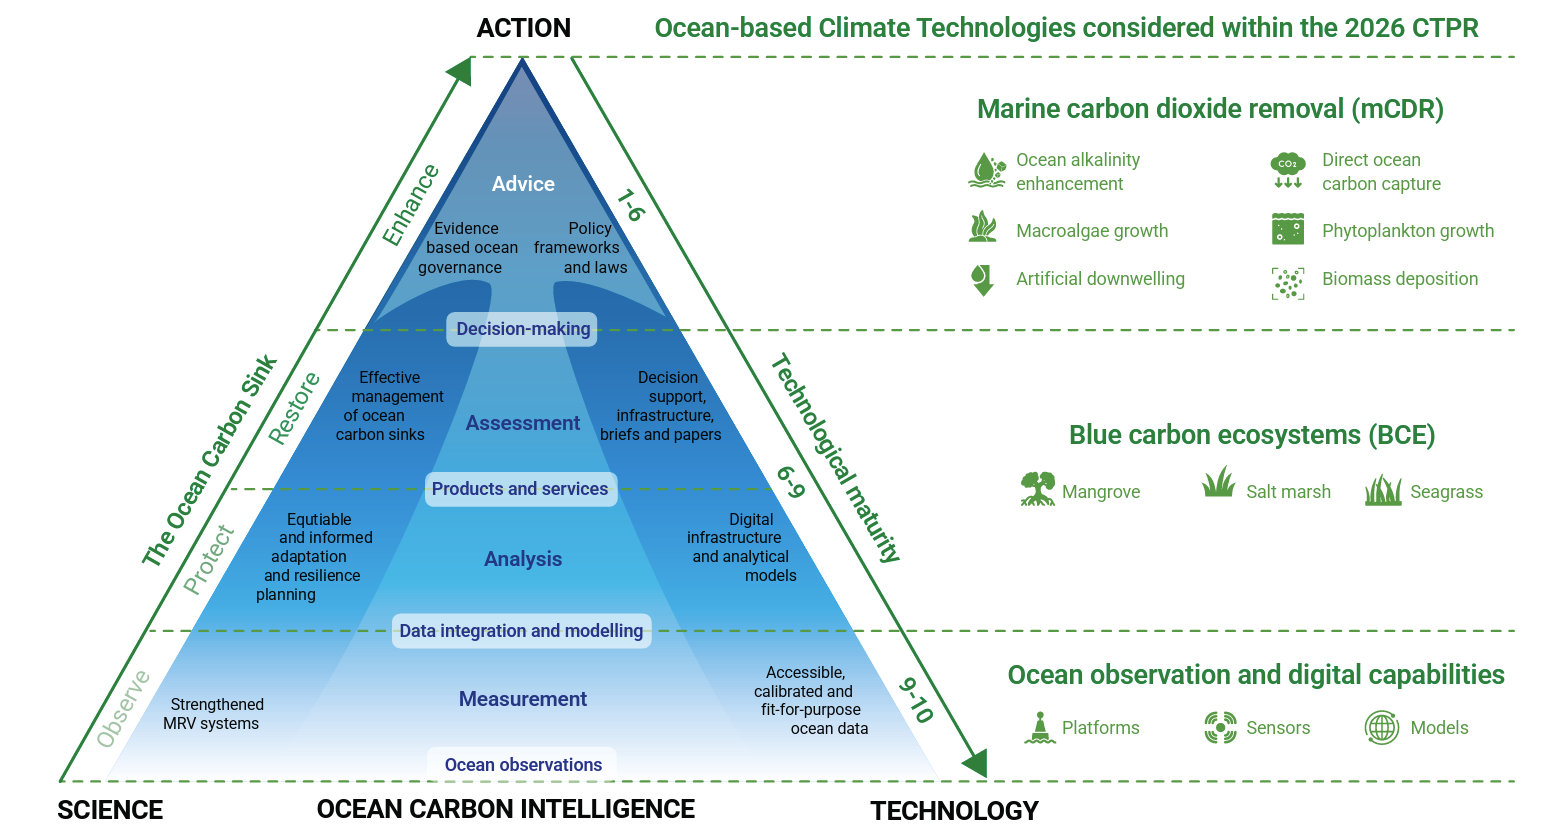
For another angle on climate tech, see the 2026 Climate Technology Progress Report which spotlights ocean science, monitoring technologies, data infrastructure and analytical tools to improve understanding of ocean carbon dynamics and support evidence-based climate action.

UNEP also published a report on the synergies between climate action and air pollution: Hidden assets: The economic and health case for climate and clean air action.
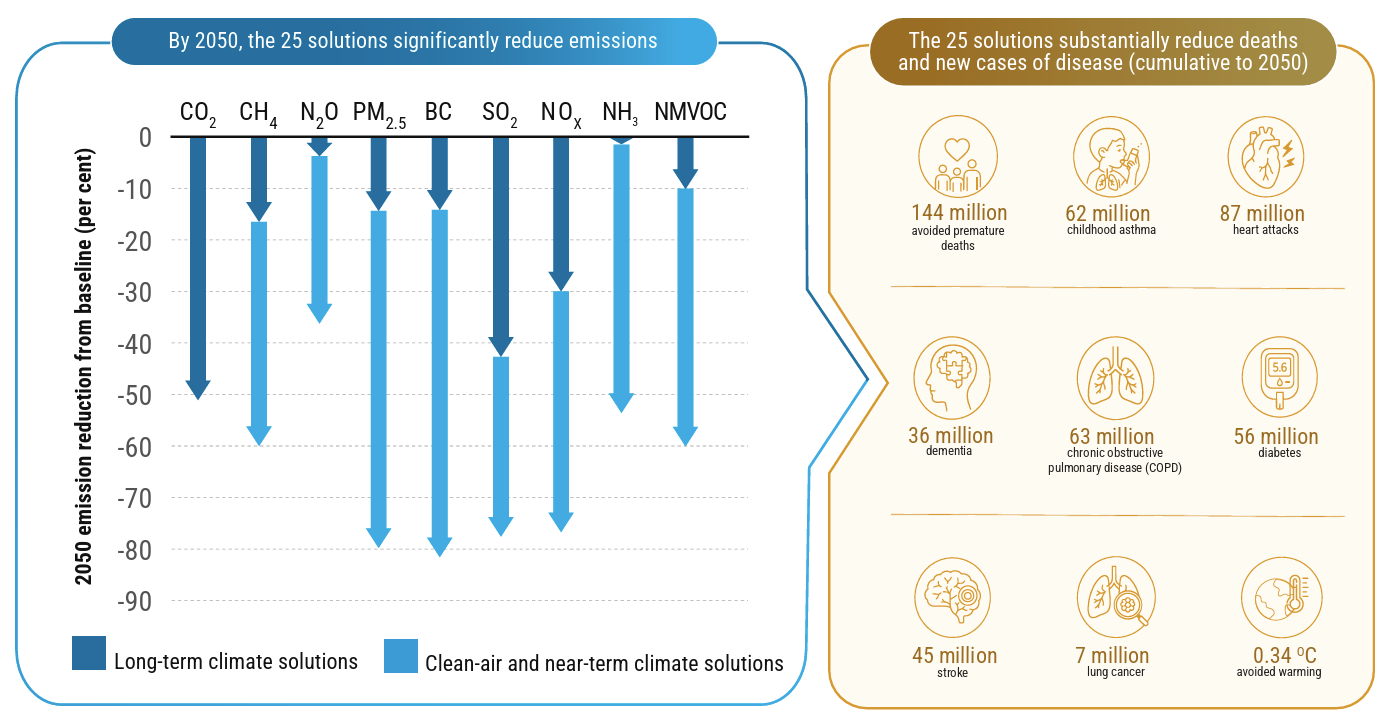
The report narrows in on 25 proven solutions across energy, industry, transport, agriculture, cooking and waste. These are mostly the obvious things: clean cooking and heating, electrification of transport, prevention of forest and peatland fires, reduction of flaring and leaks in the oil and gas sector, and so on.
These solutions reduce pollutants and, therefore, reduce the health-related effects such as childhood asthma and lung cancer (see below).
This ravaging of affected communities shows up as avoided economic costs from avoidable sick leave, early mortality, health spending, and so on. By working through its public and private costs, this deterioration of human wellbeing can be shoehorned into cost-benefit analysis, in order to sway the decision makers who purport to make decisions only on this reptilian basis:
The 25 solutions, if implementation begins immediately, could generate economic benefits equivalent to about 2.8 (2–4) per cent of global gross domestic product (GDP) by 2035, 4.5 (3–6) per cent by 2050, and approximately 11.4 (8–14) per cent by 2100.
That's a benefit-cost ratio of 15 dollars of economic benefits for every dollar invested, as per the chart below.
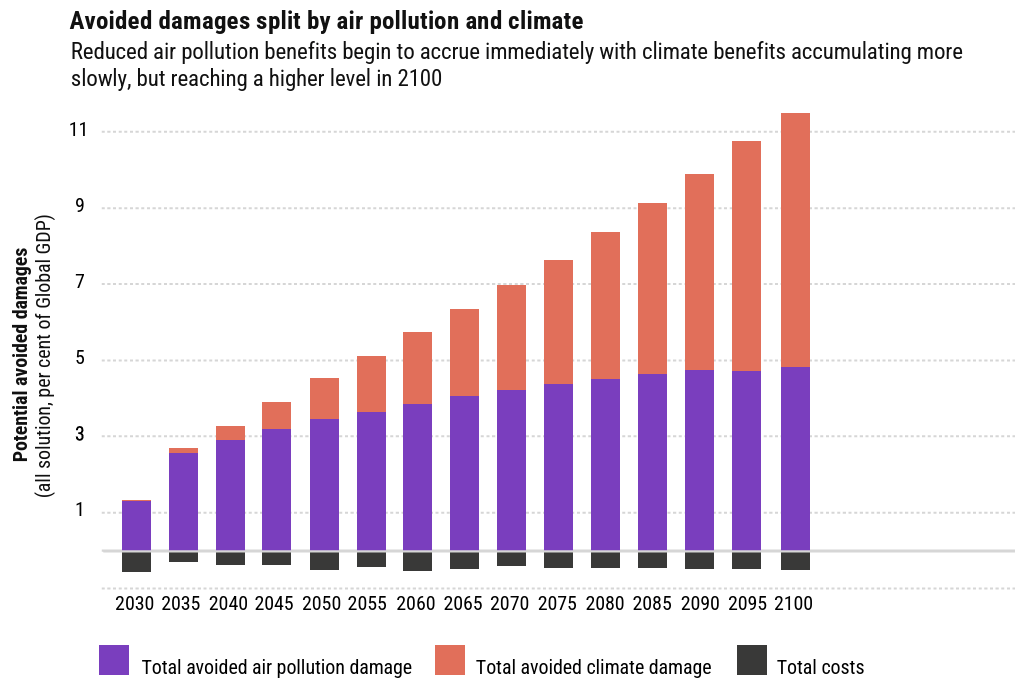
One of the strategic upshots from this chart is the frontloading of benefits from avoided air pollution. This is critical because, unlike climate damages, which are distant in time, the return-on-investment for addressing air pollution is near-term, which makes it easier to mobilize investment and support. Win on air pollution, get climate benefits for free.


To close, it is worth noting the ever-growing scrutiny over the presence of industry lobbyists at COP 31, which included an estimated 700 carbon capture lobbyists, 260 food sector lobbyists. and delegations from over 100 fossil-related corporations and industry groups. There are legitimate concerns that such estimates capture too many false positives, but the influence of lobbying is a real issue.
 Christian Downie

One counter-response to this is the Brazil-UN-UNESCO-led Global Initiative for Information Integrity on Climate Change with a mandate to to contribute to investigating, exposing, and dismantling mis- and disinformation related to climate change. Having embedded this issue into COP 30 Mutirão Decision last year, the Initiative arrived at COP 31 with new guidance on information integrity for A.I. and advertising (see below).

Thanks for reading this far! If you haven't already, please subscribe to receive future essays like this, as well as other updates and transition-related briefings.