

In this week's edition, a selection of new reports and charts that coincided with COP30. This includes charts on emissions and climate ambition, the economics of adaptation, just transitions, insurance, sustainable finance taxonomies, and economic analysis. This is not a comprehensive survey of COP30-related publications – just a selection of things that caught my eye over the last few weeks. For my reflections on COP30 itself, go to this week's edition of The Shift.
The most important chart of all: global fossil CO2 emissions. Tragically, these are projected to increase by ≈1.1% in 2025 (from Global Carbon Project's annual update).
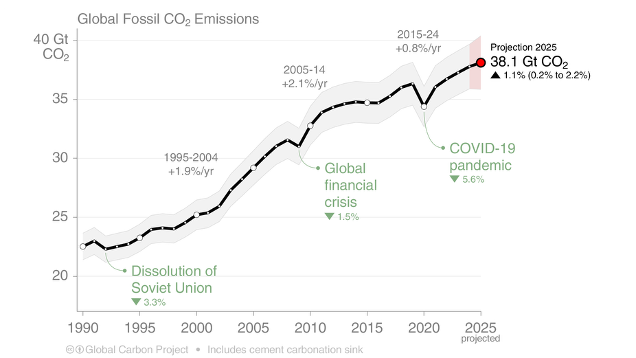
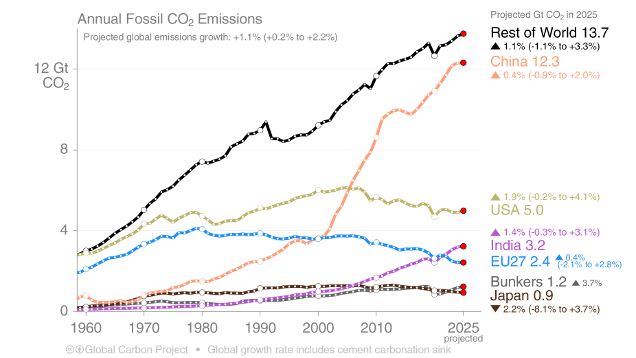
This global average disguises territorial differences. Chinese emissions are flat after two decades of precipitous growth, and India's growth is slowing. Meanwhile, the U.S. is rising and the EU27 is flat, following many years of gradual decline in both territories.
The Paris Agreement is ratcheting up ambition over time. Current commitments still fall short of what is needed, and there is no guarantee that country-level pledges (NDCs) will be met with action. But the UNFCCC's annual synthesis report shows that increased ambition is the trend overall...
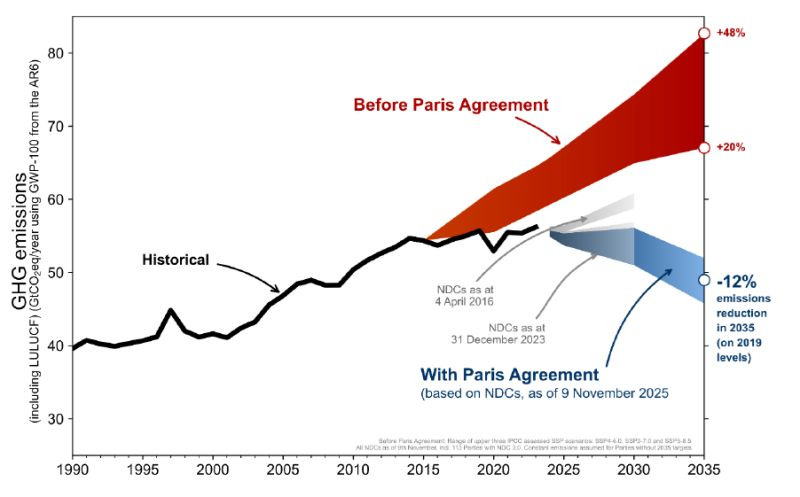
... but the world is still far from aligning to the Paris Agreement thresholds of 2°C and ideally 1.5°C.
The Emissions Gaps Report 2025 puts us on track ≈2.8°C under current policy settings. If countries fully implement their pledges, known as Nationally Determined Contributions (NDCs), then peak warming is projected at ≈2.3–2.5°C. Only once we account for net-zero pledges, such as New Zealand's domestic 2050 target under the Zero Carbon Act, as well as NDCs, does projected heating dip down to ≈1.9°C.
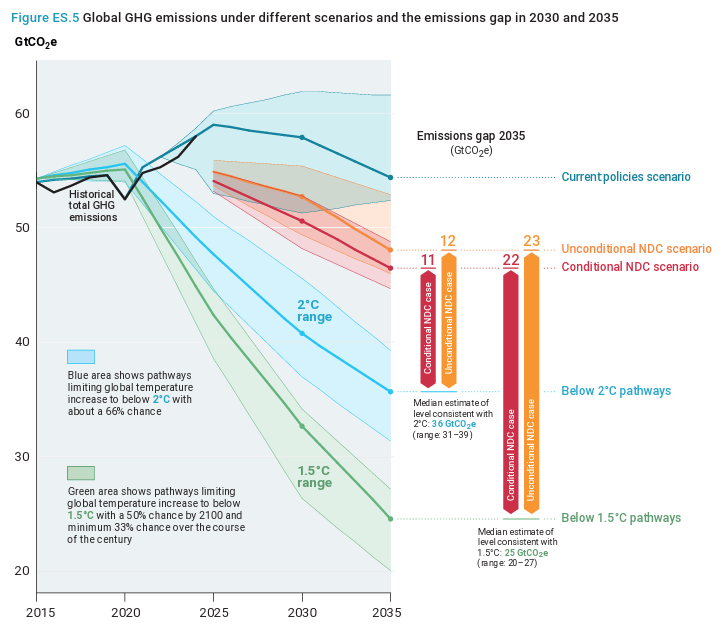
This is a significant improvement on the >4°C of heating that was expected when I first started worrying about climate change in the late 1990s, but these levels of global heating are still highly destructive. To align with the Paris Agreement, the world's NDCs need to increase ambition by 11–12 gigatonnes to stay under ≈2°C, or 22–23 gigatonnes to stay under ≈1.5°C. Furthermore, the pledges must be fully implemented, which cannot be safely assumed.
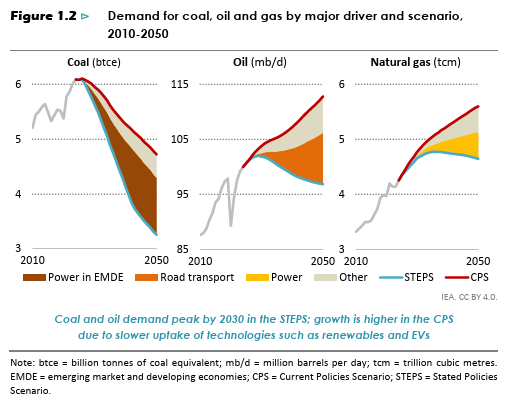
The International Energy Agency (IEA) published its World Energy Outlook 2025, which forecasts that the peak of fossil fuel consumption could be near.
Under its Stated Policies Scenario (STEPS), which draws on the stated policy intentions of the world's governments, then coal is at or near its peak, with oil set to begin declining around 2030 and gas by 2035. Even under the Current Policies Scenario (CPS), which projects the status quo into the future, coal is expected to decline, although oil and gas keeps rising. This highlights the importance of policy implementation: if governments do what they're pledging to do, it is quite possible to bend the curve on fossil fuel demand.
Notably, STEPS is only as ambitious as government commitments. The IEA developed its own Net Zero Emissions (NZE) Scenario in 2021, based on its own assessment of what was technologically feasible. While STEPS takes us to ≈2.5°C by the end of the century, the NZE Scenario is designed to keep us under 1.5°C.

In terms of feasibility, the real world is actually outperforming the NZE Scenario on solar and wind deployment, nearly on track with EV sales, and lagging on energy efficiency. Only carbon capture has completely failed to fire.
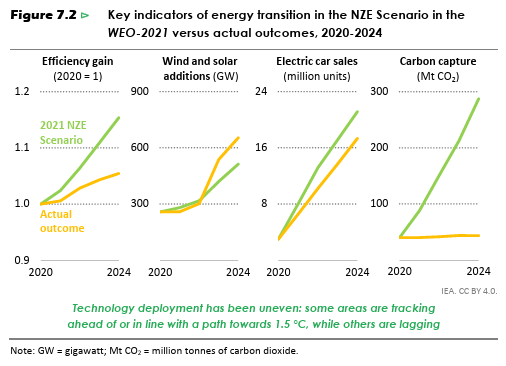
Funny how reality perfectly defies what a generation of pro-fossil, anti-renewables 'realists' have advised the public about what is and isn't possible.
Eco-economic decoupling – where economic growth occurs without a corresponding increase in ecological harm – is becoming more pronounced for CO2 emissions. Exponential Roadmap Initiative is calling this 'crocodile economics' for the shape it creates on a chart.
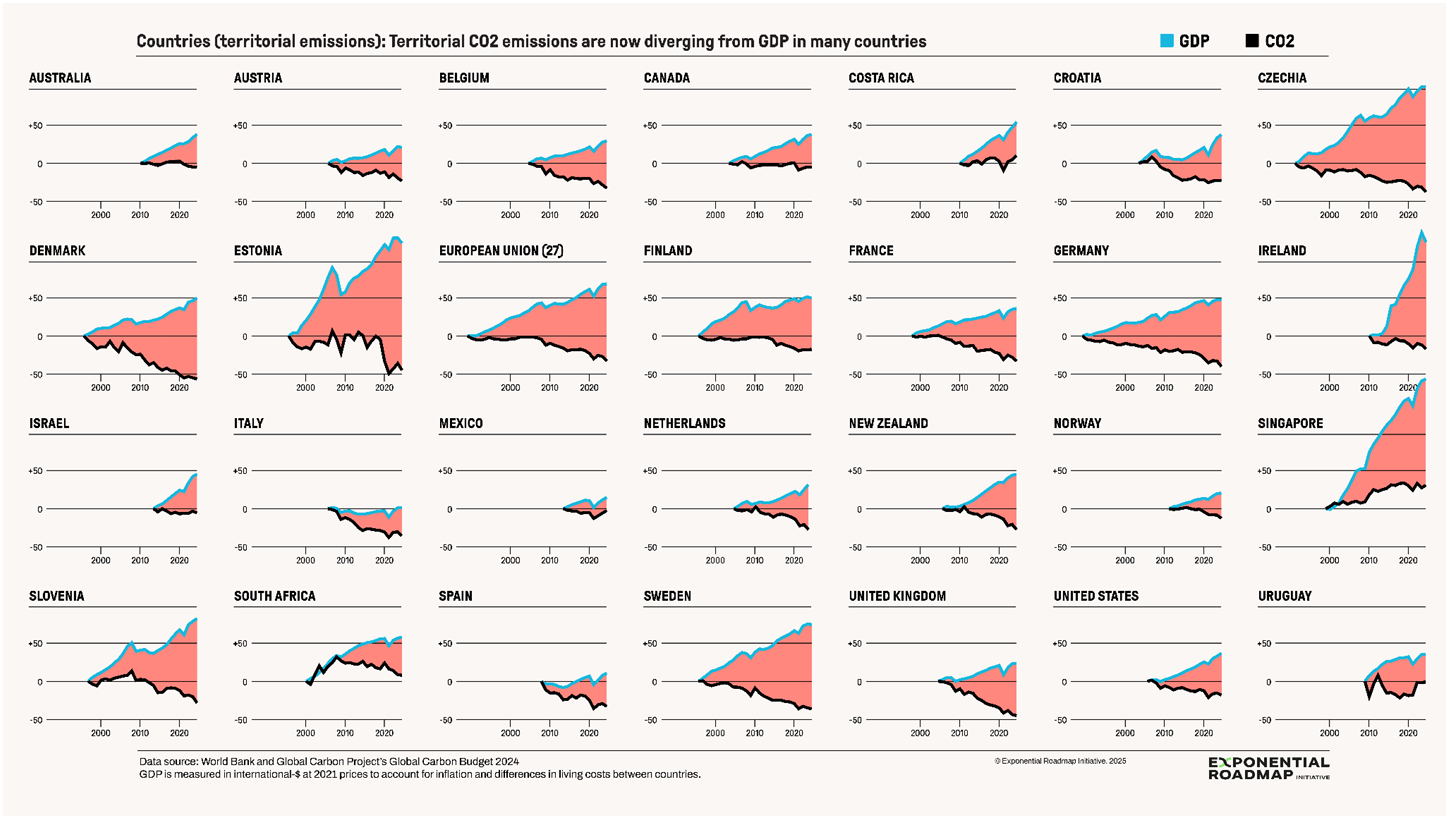
This is occurring for some countries (above) as well as some companies (below) where corporate revenue diverges from Scope 1, 2 and 3 emissions. But these trends, while promising, do not justify green growth triumphalism. As Jason Hickel and Jefim Vogel note in their 2023 Lancet article: 'The decoupling rates achieved in high-income countries are inadequate for meeting the climate and equity commitments of the Paris Agreement and cannot legitimately be considered green.'

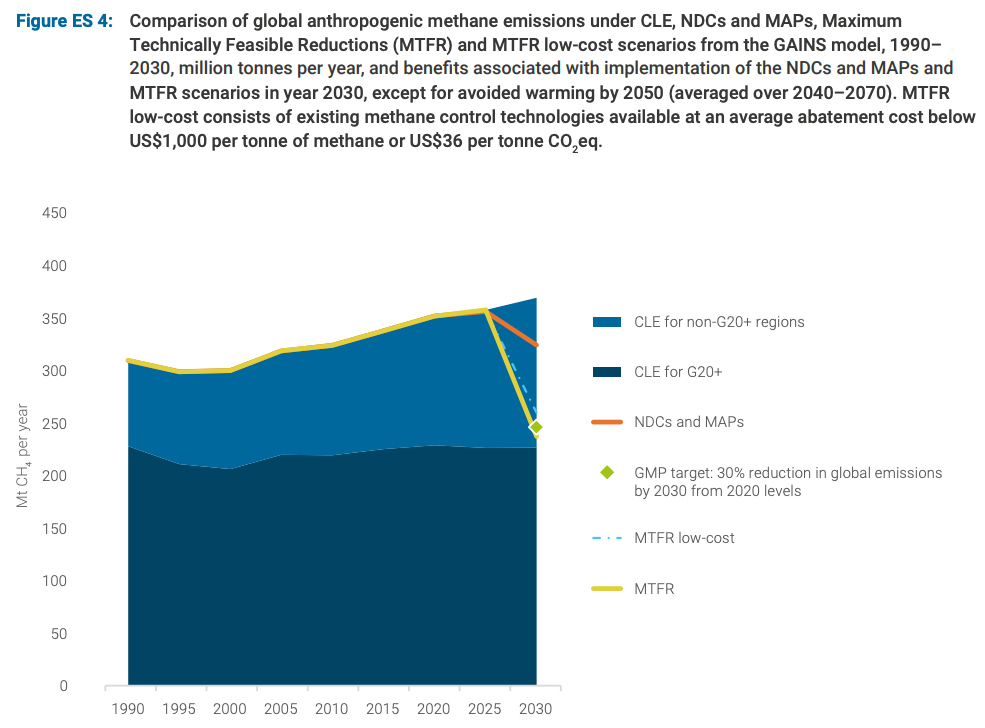
The first ever Global Methane Status Report was published to support the Global Methane Pledge (GMP). It estimates that global anthropogenic emissions of methane reached 352 million tonnes per year in 2020 and, under current legislation, will increase by 5% by 2030 to reach 369 Mt per year.
The analysis estimates that enacting Nationally Determined Contributions and Methane Action Plans (NDCs and MAPs) could generate an 8% reduction in methane below 2020 levels. This translates to 0.06°C of avoided warming by 2050 when compared to the Current Legislation Emissions (CLE) scenario.
Under a more ambitious scenario, which enacts Maximum Technically Feasible Reductions (MTFR) at an average abatement cost below US$36 per tonne CO2 eq, it is possible to drive methane reductions at 32% below 2020 emissions levels. This translates to 0.2°C of avoided warming by 2050.
Adaptation funding is down according to this year's Adaptation Gap Report by UNEP:
International public adaptation finance flows to developing countries were US$26 billion in 2023: down from US$28 billion the previous year. This makes adaptation financing needs in developing countries 12-14 times as much as current flows.
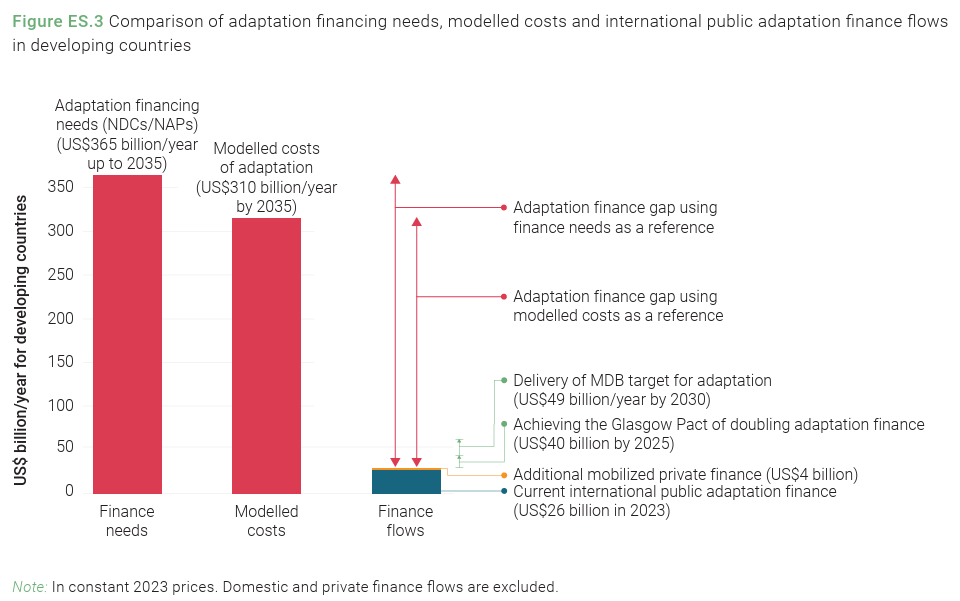
Note that this decline is heading in the opposite direction to the COP30 Belém Package which agrees to triple adaptation financing by 2035. And even that increased commitment is insufficient to bridge the adaptation financing gap.
The flagship report of the Global Initiative on Jobs & Skills for the New Economy estimates that closing this adaptation financing gap would result in significant job creation, adding 190 to 375 million new jobs over the next decade.
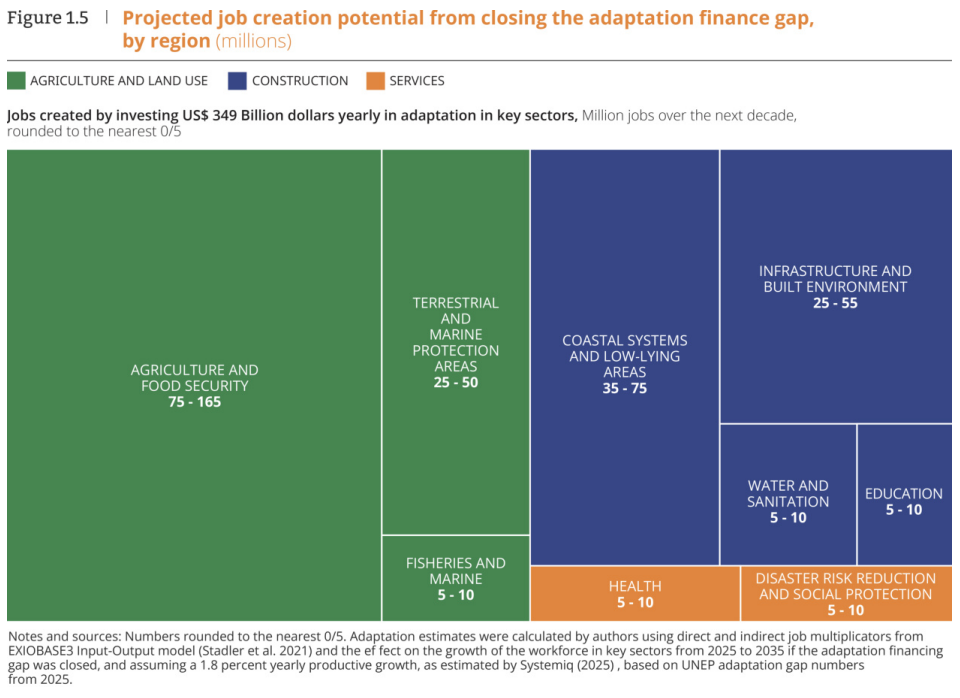
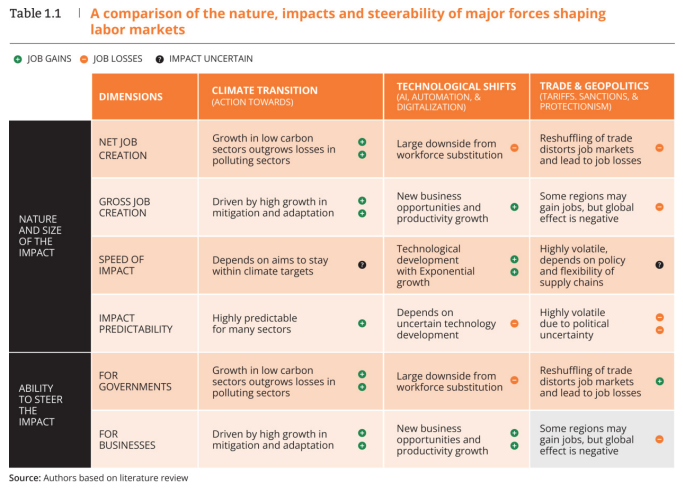
The report notes that, within the wider context of disruption from technology (e.g. AI) and geopolitics (e.g. trade protectionism), climate action is potentially a major source of job creation to offset job losses elsewhere.
Morphosis, a self-described 'merchant bank' for climate resilience, released a new report on the adaptation economy. It proposes an Adaptation Economy Policy Framework (see below) to coordinate policy makers, investors and solutions providers, and thereby catalyze adaptation markets.

As agriculture is increasingly exposed to climate-related impacts, insurance is emerging as a potentially powerful lever for transition finance to regenerative agriculture and re/afforestation.
A white paper by Howden, BCG and Climate High-Level Champions estimates that, at the portfolio level, each $1 of premium spent on insurance can unlock between $3 and $10 in additional lending.

This demonstrates the leverage effect between risk transfer and credit expansion. But I do worry about the expansion of private debt as a 'climate solution', especially when the physical risks of climate change are worsening because governments and businesses (including agri-businesses) are failing to abate emissions.
One of the strongest and simplest arguments for developing a sustainable finance taxonomy is that, in a world where other countries have taxonomies, we are better off having one too.
Now we have improved visibility on global developments thanks to the Sustainable Finance Taxonomy Mapper:
This was part of a package of initiatives launched around COP30 which aim to improve the interoperability of global taxonomies. This includes the Principles for Taxonomy Interoperability to ensure that taxonomies are usable, credible and comparable across borders. Relatedly, Brazil's Ministry of Finance is advancing the concept of a Super Taxonomy through the COP30 Action Agenda, led by the brilliant Cristina Reis, Undersecretary for Sustainable Finance.
New Zealand is currently developing a taxonomy (disclosure: I'm on its Technical Experts Group), which makes it one of over 60 national and regional taxonomies either in use or development.
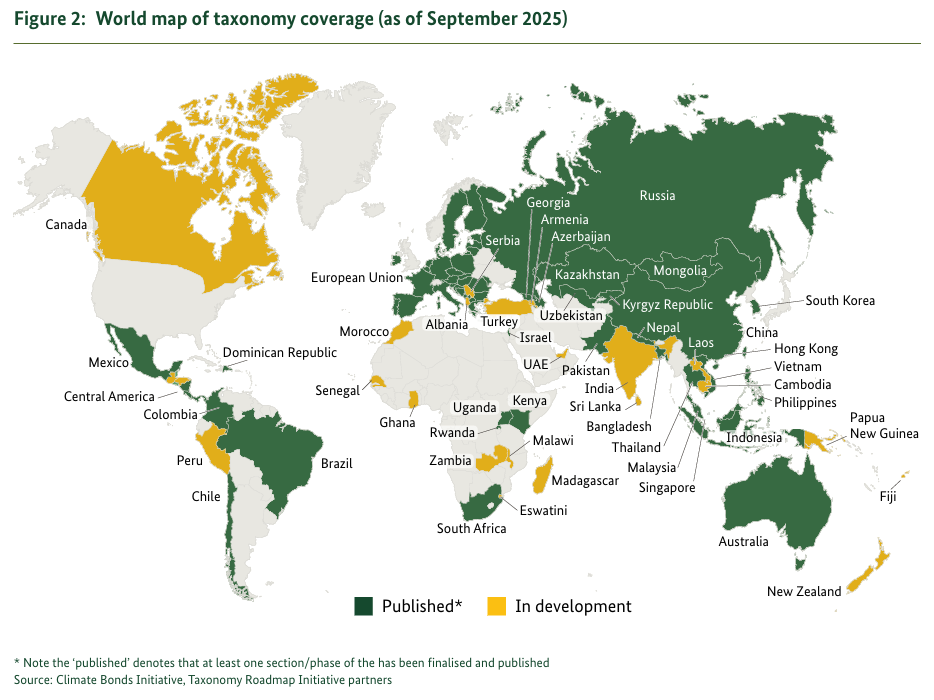
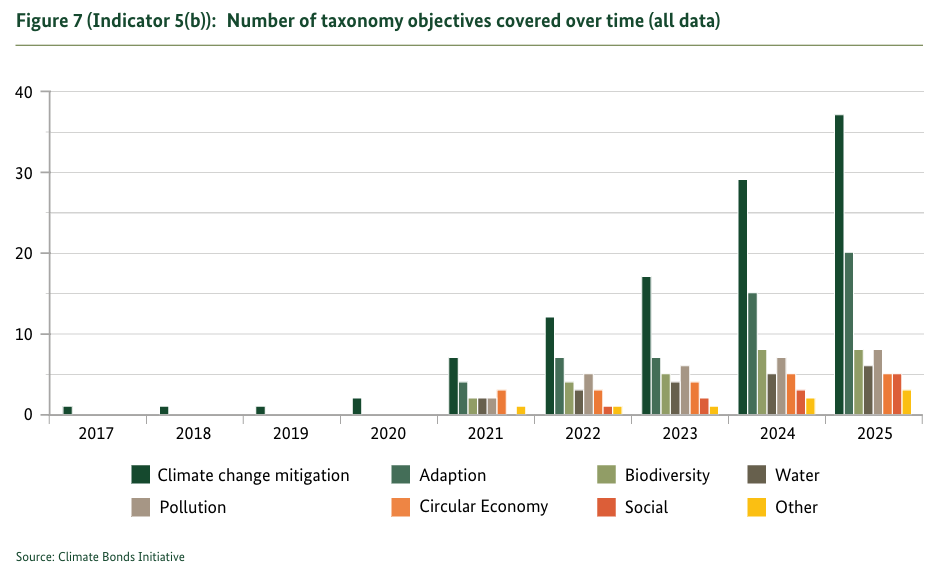
The primary focus of taxonomies globally is climate mitigation, but other themes are starting to gather pace, especially adaptation and resilience.
Finally, a report by the Coalition of Finance Ministers for Climate Action (CFMCA) calls for Ministers of Finance (MoFs) to take a pluralist approach to economic analysis and modelling. The report argues:
No one tool can effectively address all climate-related policy questions. Different questions demand analytical tools with different perspectives that capture alternative output variables and insights. Provided that sufficient capacity exists, multiple tools can be useful to answer different aspects of a single overarching policy question or can help indicate the sensitivity of results to the analytical tool and assumptions employed. With access to a diverse suite of tools, decision-makers in MoFs can draw on a more robust foundation for evidence-based policymaking.
The analytical tools the report reviews are summarized below:

Given the ideological style that currently dominates the New Zealand Government's approach to economic analysis and policy design, it is worth quoting at length the CFMCA's view on policy development and appraisal:
The need for green and resilient transitions comes with a range of challenges and typically requires multiple policy levers to be pulled simultaneously. This may include pricing emissions, fossil fuel subsidy reform, incentivizing research into and deployment of green technologies, and managing the distributional consequences and ensuring a just transition through policies that dampen the impacts for adversely affected sectors and groups. Moreover, MoFs already operate in an environment of policy mixes, whether or not they were initially designed as coherent packages. Given the need to use a range of policy levers, it should be considered whether the analytical tools applied reflect relevant levers and the interactions between them in a manner that is adequate for the questions at hand or whether the tools need to be enhanced or complemented. Analysis of the fiscal impacts of such policy combinations and potential financing options can help assess whether policy packages are fiscally viable and inform strategies to make them so. Tools that reflect public finances—including revenues, expenditures, and debt dynamics—can support this.
Thanks for reading this far! If you haven't already, please subscribe to receive future content like this, as well as essays and transition-related briefings.